
Visualization Practice
Let's revisit the "Simple Program"
First, there are several elements of my code that we can improve, so this will let me reiterate some of the golden rules.
Second, below I'll create variables based only on group data. Here, it's computing returns for a firm (i.e. the "group" is all observations for a single firm), but this is broadly applicable (you can change the group to "firm-year" or "industry" or "industry-year" or "industry-year-state" or...
Third, we get to practice plotting, and then improving bad plots.
import pandas as pd
import numpy as np
import pandas_datareader as pdr # you might need to install this (see above)
import matplotlib.pyplot as plt
import seaborn as sns
import statsmodels.api as sm

# don't copy and paste these lists and number in several places
# (which is what the original "simple program" did... that's bad programming!)
# instead, create a var - if we change it here, it changes everywhere
stocks = ['AAPL','MSFT','VZ']
start_yr = 2000

# load
stock_prices = pdr.get_data_yahoo(stocks, start=start_yr)
stock_prices = stock_prices.filter(like='Adj Close') # reduce to just columns with this in the name
stock_prices.columns = stocks # put their tickers as column names
stock_prices # print
# this is wide data... so if we want to create a new variable, we have to do it once for each firm...
# what if we have 1000 firms? seems tough to do...
# make long/tidy:
stock_prices = stock_prices.stack().swaplevel().sort_index().reset_index()
stock_prices.columns = ['Firm','Date','Adj Close']
stock_prices # print - now that is formatted nicely, like CRSP!

# note: we might have to tweak the regression section of "Simple Program"
# to work with the long data, but I suspect that it would be shorter code and
# more "generally applicable" (ie easily work with N=1000+ firms)
# add return var.
# MAKE SURE YOU CREATE THE VARIABLES WITHIN EACH FIRM - use groupby
stock_prices['ret'] = stock_prices.groupby('Firm')['Adj Close'].pct_change()
stock_prices # print - the first ret for each firm should be missing...
Questions:
- Check that there are 3 missing observations of
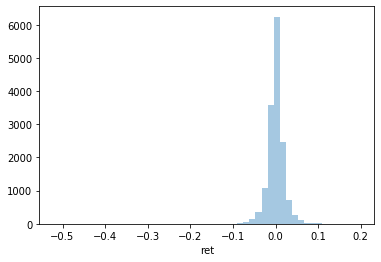
ret: the first return for each shouldn't exist. - Describe returns for each firm separately (i.e. make one table), and your answers should match mine below.
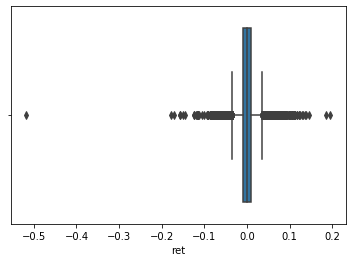
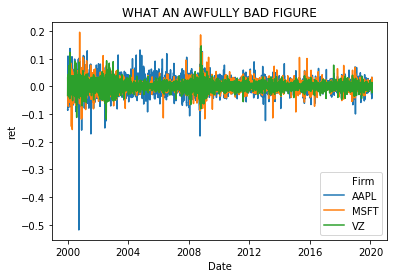
- Replicate and then improve each of the three figures below.
- Are there any issues with this data as is? How would you fix it?
Pushing ASGN-02 further
Let's make a new figure and explore some new variables, which are described at https://github.com/LeDataSciFi/lectures-spr2020/tree/master/assignment_data
Copy this cell into your live coding notebook and run it to get a firm-year (1 obs per firm per year) dataset:
stocks = pd.read_stata('https://github.com/LeDataSciFi/lectures-spr2020/blob/master/assignment_data/stocks_2006.dta?raw=true')
stocks.name = "Stocks"

# convert to annual return and std deviation
annual = pd.DataFrame() # open an empty dataframe
annual['ret'] = (stocks.assign(ret=stocks['ret']+1) # now we have R(t) for each observation
                       .groupby('permno')['ret']    # for each firm,
                       .prod()                      # multiple all the gross returns
                       -1                           # and subtract one to get back to the total period return
)
annual['std'] = stocks.groupby('permno')['ret'].std().mul(np.sqrt(250)) #times sqrt(250) to annualize
annual['year'] = stocks.groupby('permno')['date'].first().dt.year

# get firm information
# this firm file is like prior, but includes more variables
# investing, financing, industry competition and more!
# VARIABLE DESCRIPTIONS IN README AT: https://github.com/LeDataSciFi/lectures-spr2020/tree/master/assignment_data
firms = pd.read_stata('https://github.com/LeDataSciFi/lectures-spr2020/blob/master/assignment_data/firms_2006_fuller.dta?raw=true')
firms.name = "Firms"

# merge firm data with annualized stock data
firms = firms.merge(left_on=['lpermno','fyear'],
            right=annual, right_on=['permno','year'],
            how='inner')

# and this is a subsample of a few industries and states
subsample = firms.query('state in ["CA","NY"] & gsector in ["40","45"]')