
Pandas Practice
import pandas as pd
import pandas_datareader as pdr # IF NECESSARY, from terminal: pip install pandas_datareader
import datetime
import datadotworld as dw # follow instructions for installing and using dw in accompanying lecture
import numpy as np
# get the data
baby_names = dw.load_dataset('nkrishnaswami/us-ssa-baby-names-national')
baby_names = baby_names.dataframes['names_ranks_counts']
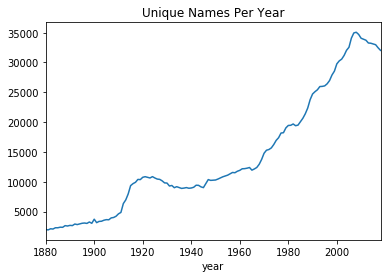
# a silly observation
(baby_names.pivot_table(index='year',values='name',aggfunc='count') # count unique names per year
    .plot.line(title='Unique Names Per Year',legend=False) # plot it, uses panda
)
(baby_names.sort_values(['year','sex','count'],ascending=False) # sort descending so most popular name first
     .groupby(['year','sex']) # group by year and gender
     .agg(lambda x: x.iloc[0]) # keep the first (most popular) name each year
     ['name'] # keep only the name variable
     .unstack() # format wide
     [-20:]
)
A side lesson: What on earth is lambda?
Can you survive without learning lambda? Yes.
But knowing lambda will make you a more powerful programmer, because it lets you define functions very quickly. And this is very useful! For example, the agg function can apply any function, not just built-in ones, and sometimes you'll want to use non built-in functions!
So, generally, the syntax is <fcn_name> = lambda <argument> : <function>.
my_fcn = lambda a : a*5 # if I call my_fcn(7), python will set a=7, then evalute the function a*5
print(my_fcn(7))
Now, in the example above inside agg() I never named the function. That's because it's unnecessary in that context, python knows to immediately call it.
def return_first_element(df):
    return df.iloc[0]

(baby_names.sort_values(['year','sex','count'],ascending=False) # sort descending so most popular name first
     .groupby(['year','sex']) # group by year and gender
     .agg(return_first_element) # keep the first (most popular) name each year
     ['name'] # keep only the name variable
     .unstack() # format wide
     [-20:]
)
(baby_names.query('year >= 1970') # let's focus on the last 50 years, maybe old-timey people had different naming rules
           .assign(last_letter = baby_names['name'].str[-1]) # get the last letter of each name string
           .assign(male = baby_names['sex'] == 'M') # = 1 if male, 0 else
           .assign(female= baby_names['sex'] == 'F') # = 1 if female, 0 else
           .pivot_table(index='last_letter',values=['male','female']) # average of male & female variables --> % of each
           .sort_values('male') # so the figure is in order
           .plot.barh(figsize=(7,7), # make it a bit bigger
           title = 'Gender fraction by last letter in name \n \n "Feminine letters": A,H,E,I,Y')
           .set_ylabel("<-----Femine letters                         Masculine letters----->")
)
start = datetime.datetime(2010, 1, 1) # you can specify start and end dates this way
end = datetime.datetime(2013, 1, 27)
macro_df = pdr.data.DataReader(['GDP','CPIAUCSL'], 'fred', start, end)
- Q0: Do each of the four new golden rules for initial data exploration, from the lecture.
- Q1: What is the second series above?
- Q2: What is the frequency of the series?
- Q3: What is the average ANNUAL GDP, based on the data?
# do your work here
# do your work here
# LOAD DATA AND CONVERT TO ANNUAL

start = 1990 # pandas datareader can infer these are years
end = 2018
macro_data = pdr.data.DataReader(['CAUR','MIUR','PAUR', # unemployment
                                  'LXXRSA','DEXRSA','WDXRSA', # case shiller index in LA, Detroit, DC (no PA  available!)
                                  'MEHOINUSCAA672N','MEHOINUSMIA672N','MEHOINUSPAA672N'], #
                                 'fred', start, end)
macro_data = macro_data.resample('Y').first() # get's the first observation for each variable in a given year

# CLEAN UP THE FORMATING SOMEWHAT

macro_data.index = macro_data.index.year
print("\n\n DATA BEFORE FORMATTING: \n\n")
print(macro_data[:20]) # see how the data looks now? ugly variable names, but its an annual dataset at least
macro_data.columns=pd.MultiIndex.from_tuples([
    ('Unemployment','CA'),('Unemployment','MI'),('Unemployment','PA'),
    ('HouseIdx','CA'),('HouseIdx','MI'),('HouseIdx','PA'),
    ('MedIncome','CA'),('MedIncome','MI'),('MedIncome','PA')
    ])
print("\n\n DATA AFTER FORMATTING: \n\n")
print(macro_data[:20]) # this is a dataset that is "wide", and now
                       # the column variable names have 2 levels - var name,
                       # and unit/state that variable applies to
- Q6: for each decade and state, report the average annual CHANGE (level, not percent) in unemployment
- Q7: for each decade and state, report the average annual PERCENT CHANGE in house prices and household income
# do your work here