9.3. Expanding returns
Note
The code below might need to be modified to work as of Feb 2023. The fix is here.
9.3.1. The problem
You know the charts that show cumulative returns if you’d bought and held a stock since some long ago date? Let’s make one!
This is called “expanding returns” because you get the total returns from day 0 to day N, then from day 0 to day N+1, and so on; the window is expanding instead of having a fixed number of units or containing a specific increment of time.
9.3.2. Download the returns
We need a dataset with firm, date, and the daily return. Let’s build it:
#!pip install pandas_datareader # uncomment and run this ONE TIME ONLY to install pandas data reader
import pandas as pd
import numpy as np
import pandas_datareader as pdr # you might need to install this (see above)
from datetime import datetime

# choose your firms and dates
stocks = ['SBUX','AAPL','MSFT']
start  = datetime(1980, 1, 1)
end    = datetime(2022, 7, 31)
Tip
The code in the next block is explained more thoroughly in handouts/factor_loading_simple.ipynb in the textbook repo because that file prints the status of the data throughout. Looking at this might help.
# download stock prices
# here, from yahoo: not my fav source, but quick.
# we need to do some data manipulation to get the data ready
stock_prices = pdr.get_data_yahoo(stocks, start=start, end=end)
stock_prices = stock_prices.filter(like='Adj Close') # reduce to just columns with this in the name
stock_prices.columns = stocks # put their tickers as column names

# refmt from wide to long
stock_prices = stock_prices.stack().swaplevel().sort_index().reset_index()
stock_prices.columns = ['Firm','Date','Adj Close']

# add return var = pct_change() function compares to prior row
# EXCEPT: don't compare for first row of one firm with last row of prior firm!
# MAKE SURE YOU CREATE THE VARIABLES WITHIN EACH FIRM - use groupby
stock_prices['ret'] = stock_prices.groupby('Firm')['Adj Close'].pct_change()
stock_prices['ret'] = stock_prices['ret']
stock_prices.head(15)
| Firm | Date | Adj Close | ret | |
|---|---|---|---|---|
| 0 | AAPL | 1980-12-12 | 0.100040 | NaN |
| 1 | AAPL | 1980-12-15 | 0.094820 | -0.052171 |
| 2 | AAPL | 1980-12-16 | 0.087861 | -0.073398 |
| 3 | AAPL | 1980-12-17 | 0.090035 | 0.024751 |
| 4 | AAPL | 1980-12-18 | 0.092646 | 0.028992 |
| 5 | AAPL | 1980-12-19 | 0.098300 | 0.061029 |
| 6 | AAPL | 1980-12-22 | 0.103084 | 0.048670 |
| 7 | AAPL | 1980-12-23 | 0.107434 | 0.042199 |
| 8 | AAPL | 1980-12-24 | 0.113088 | 0.052628 |
| 9 | AAPL | 1980-12-26 | 0.123527 | 0.092310 |
| 10 | AAPL | 1980-12-29 | 0.125267 | 0.014083 |
| 11 | AAPL | 1980-12-30 | 0.122222 | -0.024304 |
| 12 | AAPL | 1980-12-31 | 0.118743 | -0.028468 |
| 13 | AAPL | 1981-01-02 | 0.120048 | 0.010988 |
| 14 | AAPL | 1981-01-05 | 0.117438 | -0.021738 |
9.3.3. Getting the expanding returns
Notice that this dataset has the simple return for a period, not the gross returns (defined here).
To compute \(R_i[0,T]\) for all firms \(i\) and each time \(T\) in the dataset, you’re going to need to use groupby. You have two equivalent options from there:
For each firm, get the
cumprod()of the gross return over its time series.df.assign(R=1+df['r']).groupby('firm')['R'].cumprod()
For each firm, take the product of \(1+r\) for all prior periods using the expanding window functionality.
df.groupby('firm')['r'].expanding().apply(lambda x: np.prod(1+x))
Which you choose is up to you, but in my testing, the cumprod approach is 2.5x faster.
stock_prices['cumret'] = \
(
    stock_prices
    .assign(ret=1+stock_prices['ret'])
    .groupby('Firm')
    ['ret']
    .cumprod()
)
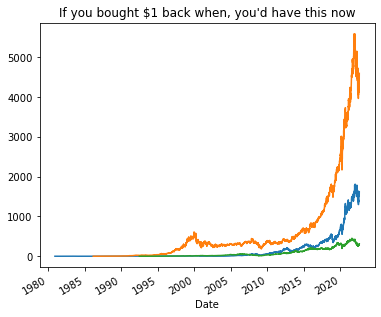
9.3.4. Plotting the total returns
If only we could turn back time.
(stock_prices.set_index('Date').groupby('Firm')['cumret']
 .plot(title="If you bought $1 back when, you'd have this now",
       figsize=(6,5))
);