3.4.1. Merging
You’ve already merged datasets. But so far, our examples have been “well-behaved” so it was easy to just proceed. But real world datasets are messy (bad variable names, poor documentation) and big, and so merging isn’t always as easy as “just do it”.
3.4.1.1. Important parameters of pd.merge()
Read through the parameters of the function here.
right = <df>,left = <df>- name of your datasetson = <var>oron = [<var1>,<var2>,...]- what variable(s) to use to match from the left and right datasets. These are your “keys”.if the variable names aren’t the same in the datasets (e.g. “ID” in one and “identity” in the other), use
left_onandright_oninstead ofonif the variables are the index variables, use
left_index = Trueand/orright_index = Trueinstead ofon
how- what observations are in the resulting dataset, see belowsuffix- if a variable is in both datasets, how should we name each.**It’s a good idea to always use this option and specify the source, because the default option makes uninformative variable names! **
indicator=Truewill create a variable saying which dataset the variable came fromvalidate= “one_to_one”, “one_to_many”, or “many_to_one”. Will check if the merge is actually what you think it is. Useful!
Be careful with the validate option
Always use the “smallest” option you think is correct: If you’re doing a 1:1, type “one_to_one”
Don’t simply change it until the merge “works”! Errors are good!
either you’re merging “wrong” (picked the wrong “on” vars),
or the data has problems (duplicates where there shouldn’t be),
or you misunderstand the data
M:M can be dangerous
The “many_to_many” will always work and is usually meaningless
NEVER USE THE MANY TO MANY OPTION (unless you’re super sure it’s correct for your application)
3.4.1.2. Categories of joins
An important concept in merging is about how the keys you’re merging on are unique or not. You should be prepared that your merge might be:
1:1: The keys in each dataset are all unique
1:M: The keys in right dataset have some duplicates
M:1: The keys in left dataset have some duplicates
M:M: The keys in both datasets have some duplicates
What the pandas documentation says is:
In SQL / standard relational algebra, if a key combination appears more than once in [either or both] tables, the resulting table will have the Cartesian product of the associated data.
That sounds complicated. What it means is: For a given row of data in the left dataset, we find all rows in the right dataset with the same key, and create that many rows in the merged dataset.
That might sounds only a little less complicated than the quote from the pandas docs. Let me just show you:
import pandas as pd
import numpy as np
import matplotlib.pyplot as plt

left_df = pd.DataFrame({
                    'firm': ['Citi','Citi',],
                    'v1': ['Alpha', 'Bravo']})
display(left_df)
| firm | v1 | |
|---|---|---|
| 0 | Citi | Alpha |
| 1 | Citi | Bravo |
right_df = pd.DataFrame({
                    'firm': ['Citi','Citi','WF'],
                    'v2': ['Charlie','Delta','Echo']})
display(right_df)
| firm | v2 | |
|---|---|---|
| 0 | Citi | Charlie |
| 1 | Citi | Delta |
| 2 | WF | Echo |
display(pd.merge(left_df,right_df,how='inner'))
| firm | v1 | v2 | |
|---|---|---|---|
| 0 | Citi | Alpha | Charlie |
| 1 | Citi | Alpha | Delta |
| 2 | Citi | Bravo | Charlie |
| 3 | Citi | Bravo | Delta |
See? Each row on the left was matched with every row in the right data with the same key.
Tip
Run this helper function before a merge. Does it think you’re doing the type of merge you think you are?
Set the
pd.merge(validate=...argument to the type of merge you think you’re doing. It will produce an error before you start if you’re wrong, at which point you should look at your data more.Set the
_indicator=Trueoption insidepd.merge(). It
def merge_type(df1,df2,on):
    '''
    This function could use case test. E.g.: multiple key vars, missing vars
    '''
    # if there are duplicates, dropping them will shrink the key vector
    if len(df1[on]) > len(df1[on].drop_duplicates()):
        _l = "many"
    else:
        _l = "one"
    if len(df2[on]) > len(df2[on].drop_duplicates()):
        _r = "many"
    else:
        _r = "one"
    return "{}_to_{}".format(_l,_r)
merge_type(left_df,right_df,'firm')
'many_to_many'
display(pd.merge(left_df,right_df,on='firm',how='inner',
                validate='many_to_many',
                indicator=True))
| firm | v1 | v2 | _merge | |
|---|---|---|---|---|
| 0 | Citi | Alpha | Charlie | both |
| 1 | Citi | Alpha | Delta | both |
| 2 | Citi | Bravo | Charlie | both |
| 3 | Citi | Bravo | Delta | both |
3.4.1.3. indicator=True
The post-merge variable created by indicator=True can be very useful to have around. After a merge, you can count the number of rows from each dataset.
some_informative_name = pd.merge(df1,df1,indicator=True)
some_informative_name['_merge'].value_counts()
In action:
pd.merge(left_df,right_df,on='firm',   how='outer',
         # NOTICE! "how" has changed from prior example to outer
                validate='many_to_many',
                indicator=True
        )['_merge'].value_counts()          # ['_merge'].value_counts()
both          4
right_only    1
left_only     0
Name: _merge, dtype: int64
3.4.1.4. how : left v. right v. inner v. outer
option |
observations in resulting dataset |
|---|---|
|
Keys ( |
|
“inner” + all unmatched obs in left |
|
“inner” + all unmatched obs in right |
|
“inner” + all unmatched obs in left and right |
Let’s illustrate that:
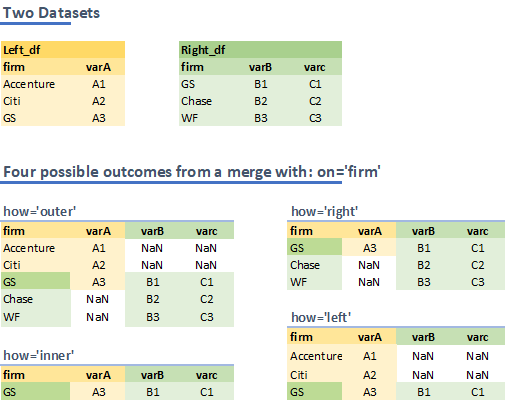
3.4.1.4.1. Practice
Do a left, right, inner, and outer merge on these datasets to confirm the illustration on how:
left_df = pd.DataFrame({
                    'firm': ['Accenture','Citi','GS'],
                    'varA': ['A1', 'A2', 'A3']})

right_df = pd.DataFrame({
                    'firm': ['GS','Chase','WF'],
                    'varB': ['B1', 'B2', 'B3'],
                    'varc': ['C1', 'C2', 'C3']})
3.4.1.5. Merging in new variables to your analysis
A typical “use case” for merging: Working on some data you want to analyze (let’s call this the “left” data), and want to merge in another dataset (the “right” data) in order to add a variable to your analysis.
HOT TIPS
The number of rows in your dataset shouldn’t change! Do both of these and you’ll be set:
Set
how = 'left'From the table above, this means that the post-merge data will have a length equal to the number of unmatched rows from the left plus the number of rows from the intersection (“inner”)
Set
validate='one_to_one'orvalidate='many_to_one'This means that any observations from the left that are matched to the right (the intersection of the two datasets) can only be matched to one observation. In other words, the intersection will not be larger than it is in the left data.
You can verify your dataset is the same length before and after the merge many ways. Here is an easy one:
# a way to check:
len(df)
df = df.merge(someNewData,
              on=[listofvars],
              how='left',
              validate='one_to_one' or 'many_to_one')
len(df)
3.4.1.5.1. Creating variables around a merge
Suppose you want to merge in a new variable. The variable is a function of a variable in another dataset. Should we create the variable before the merge or after the merge?
# before
newVar = function(right['x'])
left.merge(newVar)

# after
merge = left.merge(right)
merge['newVar'] = function(merge['x'])
Both are feasible! So which should you choose?
Note
Golden Rule 4.B from the Good Analysis Practices chapter is “Keep data normalized as far into your code pipeline as you can.”
One implication of that is to create variables on the “smallest” dataset where you can validly compute the variable. By “smallest”, I mean: the dataset where the units exactly correspond to the statistic you have in mind.
If you want to calculate the variance of annual industry sales, open an industry-level dataset with annual sales, and take the variance. Do not merge annual sales into a industry-day level dataset (with many days for each industry) and then take the variance.
Let’s illustrate:
right = pd.DataFrame({
                   "industry":[1,2,3,4,5,6],
                   })
right['x'] = pd.DataFrame(np.random.randint(0,10,size=(6, 1)), columns=list('x'))
display(right)
print("STD if you calculate it before the merge:",right.x.std())
| industry | x | |
|---|---|---|
| 0 | 1 | 7 |
| 1 | 2 | 1 |
| 2 | 3 | 0 |
| 3 | 4 | 2 |
| 4 | 5 | 2 |
| 5 | 6 | 4 |
STD if you calculate it before the merge: 2.503331114069145
So that is the correct standard deviation.
If you use this as the right dataframe in a M:1 merge with an industry-day dataset as the left, our right df will show up in the post-merge dataset many times: Eeach 1 of the right is matched to the left M times.
after_merge = right
after_merge = after_merge.append(right).append(right).append(right).append(right).append(right)
print("STD if you calculate it after the merge:",after_merge.x.std())
STD if you calculate it after the merge: 2.3176342617912282
3.4.1.6. Tips and best practices
Warning
Tip
⭐⭐⭐ THESE ARE IMPORTANT ⭐⭐⭐
Pick the “keys” you’ll merge on
What are the observation units in each of your datasets?
What variable (or variables) should you be merging on? For example: Should you merge based on the firm, or the firm AND the year?
I usually merge with as many levels of units as are in both datasets. So if I have two firm-year datasets, I merge on firm year. If I have an asset-day dataset (stock returns) and a daily dataset (returns for the overall stock market), merge on the date.
Before (before!) your merge, examine the keys
Drop any observations with missing keys in each dataset
How many unique keys are in each dataset? Simply replace
dfandkeyvarsin this:len(df[<keyvars>].drop_duplicates()What will the observation unit be after your merge? E.g., if you have a firm dataset, and a weekly dataset, the resulting dataset might be a firm-week data.
Always specify
how,on,indicator, andvalidateinsidepd.merge()This will force you to think about the observation levels in each dataset you’re merging before you try the merge, and whether the merge you’re doing is 1:1, 1:M, M:M, or M:1.
Guess how many observations you’ll have (more or less than left? more or less than right or left?) and then check afterwards.
After the merge, check that it did what you expected, and give the resulting dataframe a good name. Don’t name it “merged”!!!
Look at a good chunk of data before and after the merge. This is just following the “look at the data” golden rule.
Examine the
_mergevariable (value_counts, e.g.)Good names: I often actively name the dataframe to the new observation level.
For example, I know exactly how
state_industry_year_dfandstate_industry_dfshould differ.
Warning
If I see assignments with a line like merged=pd.merge(), I’ll mark that down automatically.
3.4.1.7. A nice overview
The Python Data Science Handbook has a wonderful breakdown of the mechanics of merging. You should read it!