3.2.6. Using “method chains” to create more readable code
This page is about “chaining,” which is a technique (as opposed to a function) I use when writing python code, to take advantage of this fact about python:
(
    # anything between these parentheses
    # is interpreted as one line of code
    # so that long lines of code can be visually broken up
    # and chunks of code (doing a set of tasks) can be grouped
)
Code chains
help us write more readable code - the “code and the flow of execution are from top to bottom, and the function parameters are always near the function itself, unlike with heavily nested function calls”, which are common in “normal” python scripts (source: a core
pandasdev)“emphasize a correctly [and sequentially] structured interactive approach to working with data, where each operation is a ‘next step’ after the last.” (source)
lessen the need to create and mentally track temporary variables
are easy to debug: comment out operations that are failing until you fix them
you can have comments within the chains (like the example above!)
only temporarily modify the object, unless you name the object (like
name = ( ... ))
Let’s learn about chains via example.
The material chains on this page is within the “v1.+” tabs below.
Or, An analysis of the impact of Game of Thrones
This analysis will show off slicing data, computing statistics by groups, and some plotting.
I didn’t find an off the shelf data set to run our seminal analysis in Chapter 2, but I found another option.
Let’s explore if Game of Thrones changed how babies are named!1
3.2.6.1. Step 1: Download the data
#TO USE datadotworld PACKAGE:
#1. create account at data.world
#2. in terminal/powershell: pip install datadotworld
#
#   IF THIS DOESN'T WORK BC YOU GET AN ERROR ABOUT "CCHARDET", RUN:
#    conda install -c conda-forge cchardet
#   THEN RERUN: pip install datadotworld[pandas]
#
#3. in terminal/powershell: dw configure
#3a. copy in API token from data.world (get from settings > advanced)

import datadotworld as dw
import numpy as np
import pandas as pd
import seaborn as sns
import matplotlib.pyplot as plt

baby_names = dw.load_dataset('nkrishnaswami/us-ssa-baby-names-national')
baby_names = baby_names.dataframes['names_ranks_counts']
3.2.6.2. Step 2: EDA
Just because this code is skipping EDA doesn’t mean you should! Follow the best practices! In fact, I did do EDA on the dataset, which I why I knew to combine boy/girl names.
3.2.6.3. Step 3: Analysis using Chains
The general plan is to plot the number of kids each year with GoT inspired names. So the general plan is:
save a slice of the dataset with the names we want
sometimes a name is used by boys and girls in the same year, so combine the counts so that we have one observation per name per year (I learned this from EDA!!!)
save the dataset and then call a plot function
On one hand, this is only 4 lines of code. On the other hand, this is as readable as I could make it!
# STEP 1: restrict by name and only keep years after 2000

somenames = baby_names.loc[( # formating inside this () is just to make it clearer to a reader
    ( # condition 1: one of these names, | means "or"
        (baby_names['name'] == "Sansa") | (baby_names['name'] == "Daenerys") |
        (baby_names['name'] == "Brienne") | (baby_names['name'] == "Cersei") |
        (baby_names['name'] == "Tyrion")
    ) # end condition 1
    & # & means "and"
    ( # condition 2: these years
        baby_names['year'] >= 2000) # end condition 2
    )]

# STEP 2: if a name is used by F and M in a given year, combine the count variable
    # Q: why is there a "reset_index"?
    # A: groupby automatically turns the groups (here name and year) into the index
    #    reset_index makes the index simple integers 0, 1, 2 and also
    #    turns the the grouping variables back into normal columns
    # A2: instead of reset_index, you can include `as_index=False` inside groupby!
    #     (I just learned that myself!)
somenames_agg = somenames.groupby(['name','year'])['count'].sum().reset_index().sort_values(['name','year'])

# STEP 3: plot
sns.lineplot(data=somenames_agg, hue='name',x='year',y='count')
plt.axvline(2011, 0,160,color='red') # add a line for when the show debuted
Tip
query > loc
# use query to filter, and the rest is the same

somenames = baby_names.query('name in ["Sansa","Daenerys","Brienne","Cersei","Tyrion"] & \
         year >= 2000') # this is one string with ' as the string start/end symbol. Inside, I can use
                        # normal quote marks for strings. Also, I can break it into multiple lines with \
somenames_agg = somenames.groupby(['name','year'])['count'].sum().reset_index().sort_values(['name','year'])
sns.lineplot(data=somenames_agg, hue='name',x='year',y='count')
plt.axvline(2011, 0,160,color='red') # add a line for when the show debuted
Method chaining: Call the object (baby_names) and then keep calling one method on it after another.
Python will call the methods from left to right.
There is no need to store the intermediate dataset (like
somenamesandsomenames_aggabove!)–> Easier to read and write without “temp” objects all over the place
–> We don’t really care about
somenames_aggYou can always save the dataset at an intermediate step if you need to
So, the first two steps are the same, just the methods will be chained. And then, a bonus trick (pipe) to plot without saving an intermediate object.
Slice with
.queryto GoT-related namesCombine M and F gender counts if a name is used by both in the same year
Plot without saving: “Pipe” in the plotting function
Note
YUCK! The code below produces a plot identical to V1 and V2, but it is unreadable. Don’t try - I’m about to make this readable! Just one more iteration…
baby_names.query('name in ["Sansa","Daenerys","Brienne","Cersei","Tyrion"] & year >= 2000').groupby(['name','year'])['count'].sum().reset_index().pipe((sns.lineplot, 'data'),hue='name',x='year',y='count')
plt.axvline(2011, 0,160,color='red') # add a line for when the show debuted
To make this readable, we write a parentheses over multiple lines
(
    and python knows to execute the code inside as one line
)
And as a result, we can write a long series of methods that is comprehensible, and if we want we can even comment on each line:
(baby_names
    .query('name in ["Sansa","Daenerys","Brienne","Cersei","Tyrion"] & \
         year >= 2000')
    .groupby(['name','year'])['count'].sum() # for each name-year, combine M and F counts
    .reset_index() # give us the column names back as they were (makes the plot call easy)
    .pipe((sns.lineplot, 'data'),hue='name',x='year',y='count')
)
plt.axvline(2011, 0,160,color='red') # add a line for when the show debuted
plt.title("WOW THAT WAS EASY TO WRITE AND SHARE")
3.2.6.4. Analysis output
All versions of the code produce this graph:
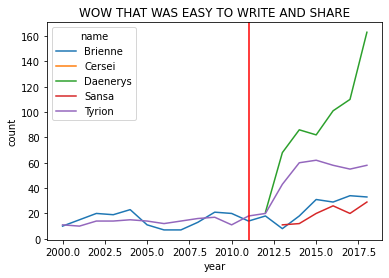
WOW. That’s nice code!
Also: Naming your baby after the “hero” Daenerys…
…is a bad break.
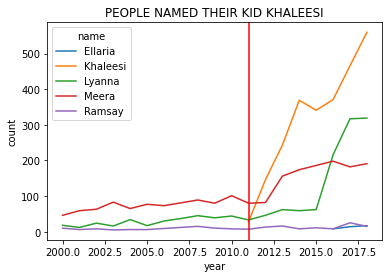
3.2.6.5. Bonus analysis
(baby_names
      .query('name in ["Khaleesi","Ramsay","Lyanna","Ellaria","Meera"] & \
         year >= 2000')
      .groupby(['name','year'])['count'].sum() # for each name-year, combine M and F counts
      .reset_index() # give use the column names back as they were (makes the plot call easy)
      .pipe((sns.lineplot, 'data'),hue='name',x='year',y='count')
)
plt.axvline(2011, 0,160,color='red') # add a line for when the show debuted
plt.title("PEOPLE NAMED THEIR KID KHALEESI")
plt.show()
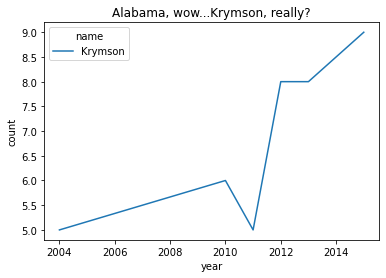
BUT IT COULD BE WORSE
(baby_names
      .query('name in ["Krymson"] & year >= 1950')
      .groupby(['name','year'])['count'].sum() # for each name-year, combine M and F counts
      .reset_index() # give use the column names back as they were (makes the plot call easy)
      .pipe((sns.lineplot, 'data'),hue='name',x='year',y='count')
)
plt.title("Alabama, wow...Krymson, really?")
plt.show()
3.2.6.6. Summary, Tips, and Techniques
Summary:
In a method chain, you can use any valid method for the object that comes before
Between two parentheses, you can break a long chain up, and add comments for readability
You’re writing a chain. Do you want to:
Create a variable? Use
.assign(<newvariablename> = <some function>)Rename a variable? Use
.rename(columns={'<oldName>' : '<newName>'})Use a non-pandas function (e.g. plotting, like above) on a pandas object? Use
.pipe(<>)
Tip
See the common functions and common tasks pages for more methods you can use in chains and tricks to use within chains (pipe, lambda functions, etc.)!
- 1
This analysis is the inspiration for our GoT analysis.