5.4.6. Optimizing a Model
This page covers:
<pipeline>.get_params()to find parameters in your pipeline to optimizeSetting up and fitting
GridSearchCV()to find optimal parametersGetting the best model after the grid search via
.best_estimator_
Lets load the data we’ve been using. (The code is here but hidden.)
import pandas as pd
import numpy as np
from sklearn.linear_model import Ridge
from sklearn.model_selection import train_test_split, GridSearchCV
from sklearn.pipeline import make_pipeline
from sklearn.impute import SimpleImputer
from sklearn.compose import ColumnTransformer, make_column_selector
from sklearn.preprocessing import OneHotEncoder
from sklearn.metrics import r2_score
url        = 'https://github.com/LeDataSciFi/ledatascifi-2022/blob/main/data/Fannie_Mae_Plus_Data.gzip?raw=true'
fannie_mae = pd.read_csv(url,compression='gzip').dropna()
y          = fannie_mae.Original_Interest_Rate

# reduce to a different set of vars than the prior pages the slow way
drop = ['Loan_Identifier','Loan_purpose','Origination_Channel', 'Seller_Name', 'Property_type', 'Occupancy_type',
       'Zip_code_short','Product_type','Co-borrower_credit_score_at_origination', 'Mortgage_Insurance_type',
       'Origination_Date', 'First_payment_date','Original_Interest_Rate','UNRATE', 'CPIAUCSL', 'Qdate', 'rGDP', 'TCMR', 'POILWTIUSDM', 'TTLCONS',
       'DEXUSEU', 'BOPGSTB', 'GOLDAMGBD228NLBM', 'CSUSHPISA', 'MSPUS',]
fannie_mae = fannie_mae.drop(drop,axis=1)
fannie_mae = (fannie_mae
              .assign(l_credscore = np.log(fannie_mae['Borrower_Credit_Score_at_Origination']),
                      l_LTV = np.log(fannie_mae['Original_LTV_(OLTV)']),
                     )
             )

# test-train
rng = np.random.RandomState(0) # this helps us control the randomness so we can reproduce results exactly
X_train, X_test, y_train, y_test = train_test_split( fannie_mae , y, random_state=rng)
Let’s set up our model. For simplicity, this model just imputes missing values of (all) numerical variables and then OneHotEncodes the state variable. Here is
preproc_pipe = ColumnTransformer(
    [ # new here: make_column_selector grabs all columns of a type
    ("num_impute",SimpleImputer(), make_column_selector(dtype_include=np.number)),
    ("cat_trans", OneHotEncoder(drop='first'), ['Property_state'])
    ]
    , remainder = 'drop'
)

ridge_pipe = make_pipeline(preproc_pipe,Ridge(1.0,
                                              tol=1e-10))
# A "technical" point on "tol" is hidden below
# it turns out that the tolerance setting matters a lot!
# the default tolerance (1e-3) is not enough to allow the estimator to find improvements here
# You can see this this way: run r2_score with tol 1e-3 and alpha 1, then alpha 100.
# You'll get the same results indicating that alpha doesn't change the estimation when the
# tolerance is weaker (1e-3 isnt as demanding as 1e-10)
Let’s use the model and compute its performance.
ridge_pipe.fit(X_train, y_train)
r2_score(y_test,ridge_pipe.predict(X_test,))
0.31696581904124665
5.4.6.1. The hyperparameters of a model
Note
How this pipeline estimator performs depends on parameters for each step, which we call “hyperparameters” in this context.
For example, the Ridge() model’s key parameter is “alpha”, and changing it will change its results. But it’s not the only parameter that can change the results of this pipeline.
Warning
Now, look how many parameters this tiny three-step model (impute, encode, ridge regression) has!
ridge_pipe # Pipeline "steps" is a list of tuples: [(name,transformer),(name,transformer),...,(name,estimator)]
Pipeline(steps=[('columntransformer',
                 ColumnTransformer(transformers=[('num_impute', SimpleImputer(),
                                                  <sklearn.compose._column_transformer.make_column_selector object at 0x00000276C62507C0>),
                                                 ('cat_trans',
                                                  OneHotEncoder(drop='first'),
                                                  ['Property_state'])])),
                ('ridge', Ridge(tol=1e-10))])
Tip
Use <pipename>.get_params() to figure out the names for parameters that you’ll explore with gridsearchcv(). I usually copy+paste the names straight off the printout.
ridge_pipe.get_params()
{'memory': None,
 'steps': [('columntransformer',
   ColumnTransformer(transformers=[('num_impute', SimpleImputer(),
                                    <sklearn.compose._column_transformer.make_column_selector object at 0x00000276C62507C0>),
                                   ('cat_trans', OneHotEncoder(drop='first'),
                                    ['Property_state'])])),
  ('ridge', Ridge(tol=1e-10))],
 'verbose': False,
 'columntransformer': ColumnTransformer(transformers=[('num_impute', SimpleImputer(),
                                  <sklearn.compose._column_transformer.make_column_selector object at 0x00000276C62507C0>),
                                 ('cat_trans', OneHotEncoder(drop='first'),
                                  ['Property_state'])]),
 'ridge': Ridge(tol=1e-10),
 'columntransformer__n_jobs': None,
 'columntransformer__remainder': 'drop',
 'columntransformer__sparse_threshold': 0.3,
 'columntransformer__transformer_weights': None,
 'columntransformer__transformers': [('num_impute',
   SimpleImputer(),
   <sklearn.compose._column_transformer.make_column_selector at 0x276c62507c0>),
  ('cat_trans', OneHotEncoder(drop='first'), ['Property_state'])],
 'columntransformer__verbose': False,
 'columntransformer__num_impute': SimpleImputer(),
 'columntransformer__cat_trans': OneHotEncoder(drop='first'),
 'columntransformer__num_impute__add_indicator': False,
 'columntransformer__num_impute__copy': True,
 'columntransformer__num_impute__fill_value': None,
 'columntransformer__num_impute__missing_values': nan,
 'columntransformer__num_impute__strategy': 'mean',
 'columntransformer__num_impute__verbose': 0,
 'columntransformer__cat_trans__categories': 'auto',
 'columntransformer__cat_trans__drop': 'first',
 'columntransformer__cat_trans__dtype': numpy.float64,
 'columntransformer__cat_trans__handle_unknown': 'error',
 'columntransformer__cat_trans__sparse': True,
 'ridge__alpha': 1.0,
 'ridge__copy_X': True,
 'ridge__fit_intercept': True,
 'ridge__max_iter': None,
 'ridge__normalize': False,
 'ridge__random_state': None,
 'ridge__solver': 'auto',
 'ridge__tol': 1e-10}
That’s a long list!
So this pipeline has parameters for every function in the pipeline:
ColumnTransformer()’s “remainder” parameter is set above as “drop” (look forcolumntransformer__remainder) but you could have chosen “passthrough”The “columntransformer__remainder” name is: the function (columntransformer), two underscores, then the parameter name
SimpleImputer()’s “strategy” parameter is set above as “mean” (look forcolumntransformer__num_impute__strategy) but you could have chosen “median”The “columntransformer__num_impute__strategy” name is like this because the imputer is nested inside the column transformer (so “columntransformer” is before the impute with two underscores), and when I created
preproc_pipe, I called the imputation step “num_impute”
OneHotEncoder()’s “drop” parameter is set toNoneRidge()’s “alpha” is set to 1.0.
5.4.6.2. Tuning hyperparameters
The basic idea is to repeatedly run the pipeline through a cross-validation while changing the hyperparameters to improve your CV scores.
To use GridSearchCV
Set up your parameter grids (all of the parameters you would like to test).
Initially, cast a wide and sparse net.
After running it once, we can run it again with more parameter values in the regions that we think the best model is in.
We will iterate on this, and repeat as needed…
Set up GridSearchCV
Get the search results by fitting GridSearchCV
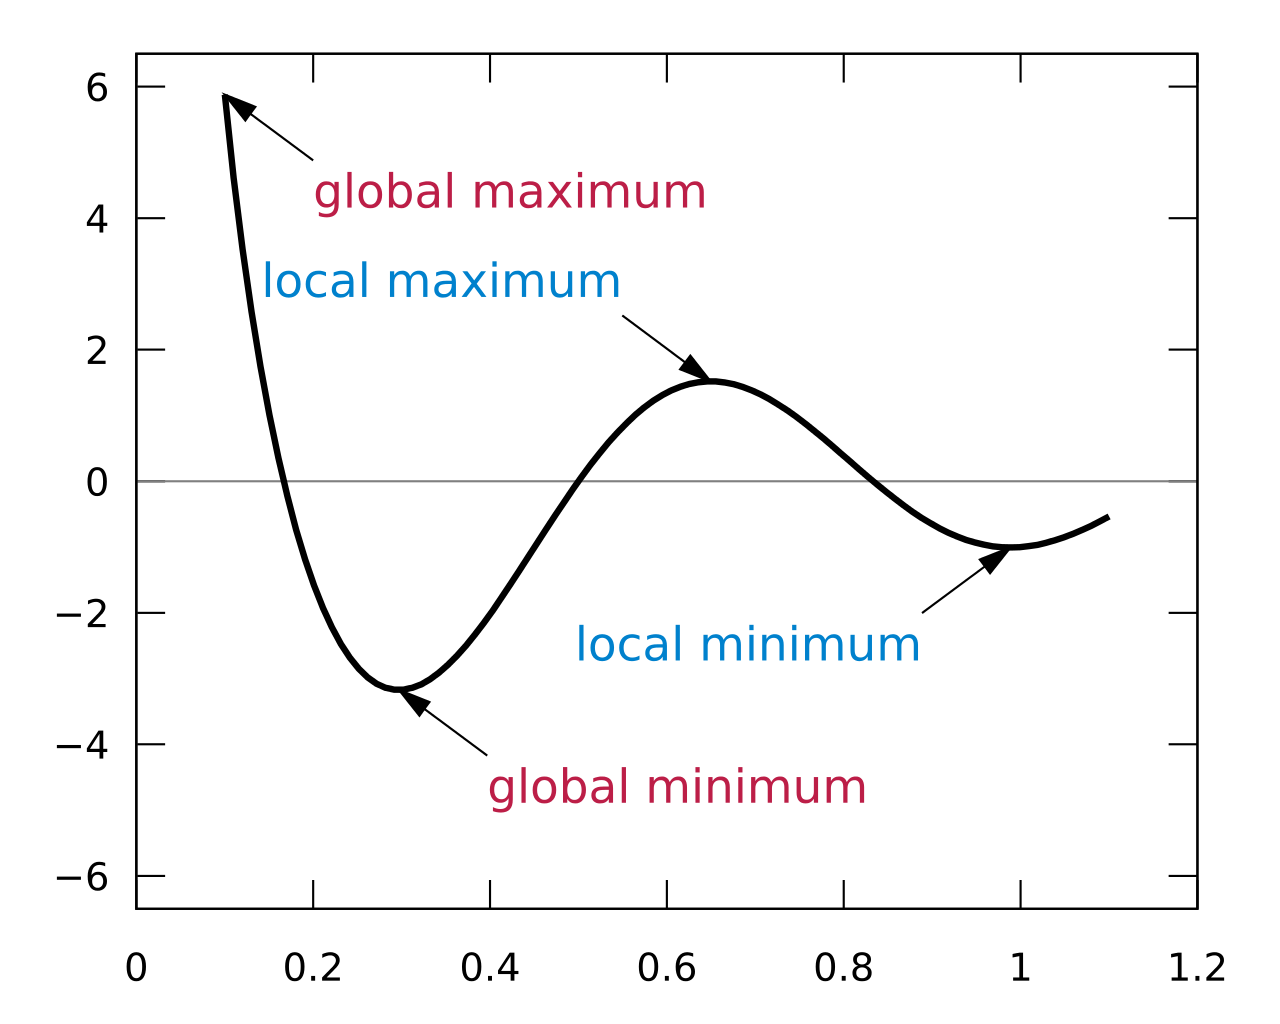
I like to visualize my CV scores on a y-axis and the parameters on the X-axis so that I know I’m at the global maximum. Just because you’re at the top of a hill doesn’t mean you’re at the top of Everest. In math terminology, you don’t want to find the local maximum, you want the global maximum:
Examine the output
Save the best parameters
Let’s optimize alpha and the imputation method.
# 1. Set up your parameter grids (all of the parameters you would like to test).

alphas = list(np.linspace(0.0001,100,25)) # cast net wide and sparse (only 25 points)
strats = ['mean','median']
parameters = {'ridge__alpha': alphas,
              'columntransformer__num_impute__strategy':strats
             }

# 2. Set up GridSearchCV

grid_search = GridSearchCV(estimator = ridge_pipe,
                           param_grid = parameters,
                           cv = 5) # some folds with whatever the default is (look it up!)

# 3. Get the search results by fitting GridSearchCV

results = grid_search.fit(X_train,y_train)

# 4. Examine the output

results_df = pd.DataFrame(results.cv_results_).set_index('params')
# extract alpha from the params variable
results_df['alpha'] = [c['ridge__alpha'] for c in results_df.index]
results_df = results_df.sort_values('alpha')
results_df.plot(x='alpha',y='mean_test_score',kind='line',
                title='CV score by alpha')

# 5. Save the best parameters

# (It's not time - this graph below doesn't look optimized, go
# more to the left!)
<AxesSubplot:title={'center':'CV score by alpha'}, xlabel='alpha'>
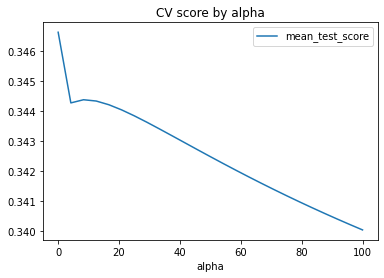
Clearly, the maximum is a very small alpha…
alphas = list(np.linspace(0.000001,0.0001,25))
# 1. Set up your parameter grids (all of the parameters you would like to test).

strats = ['mean','median']
parameters = {'ridge__alpha': alphas,
              'columntransformer__num_impute__strategy':strats
             }

# 2. Set up GridSearchCV

grid_search = GridSearchCV(estimator = ridge_pipe,
                           param_grid = parameters,
                           cv = 5) # some folds with whatever the default is (look it up!)

# 3. Get the search results by fitting GridSearchCV

results = grid_search.fit(X_train,y_train)

# 4. Save the best parameters

results_df = pd.DataFrame(results.cv_results_).set_index('params')
# extract alpha from the params variable
results_df['alpha'] = [c['ridge__alpha'] for c in results_df.index]
results_df['strat'] = [c['columntransformer__num_impute__strategy'] for c in results_df.index]

results_df = results_df.sort_values('alpha')
results_df.plot(x='alpha',y='mean_test_score',kind='line',
                title='CV score by alpha')

# 5. Save the best parameters

best_ridge = results.best_estimator_ # saves the best gridsearch model
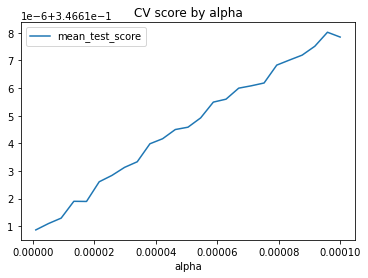
You should examine performance as a function of the other params in your gridsearch too, but here, there are no missing values in the original data of X, so the imputation choice didn’t matter!
5.4.6.3. Using tuned parameters
So how did we do? We improved from 0.317 to 0.322, a 1.6% improvement for not much work!
best_ridge.fit(X_train,y_train)      # train
r2_score(y_test,best_ridge.predict(X_test,)) # examine out of sample
0.3222479317272854