3.3.7. Upgrading Pairplots with Binscatter
Pairplots are a nice way to look are your continuous variables quickly (example), but they use scatter plots that don’t work well with many observations.
Let’s upgrade our pairplots to use hexbin plots or binscatter plots instead!
We can use pairgrid_hex_reg from the Community Codebook:
import seaborn as sns
from pairgrid_hex_reg import pairgrid_hex_reg

penguins = sns.load_dataset("penguins")
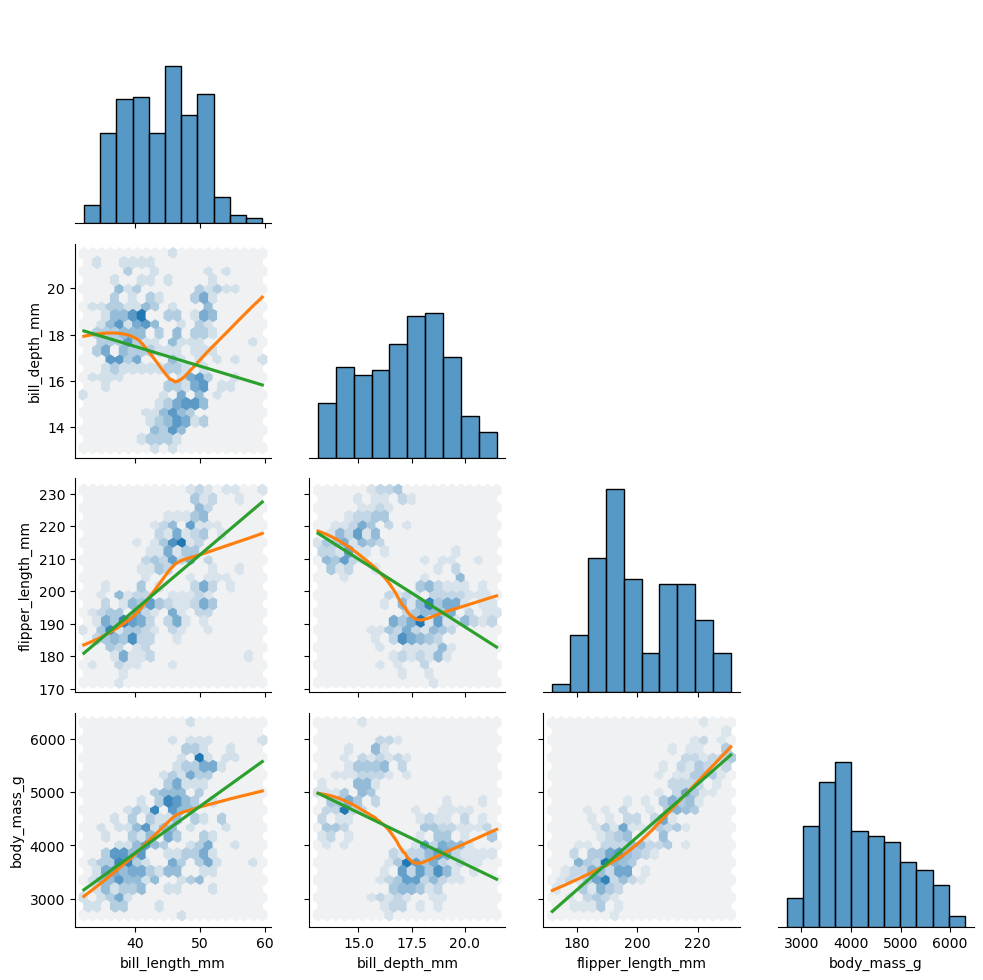
By default, it uses a hexbin representation:
pairgrid_hex_reg(penguins,hex_size=20)
<seaborn.axisgrid.PairGrid at 0x17b9802c850>
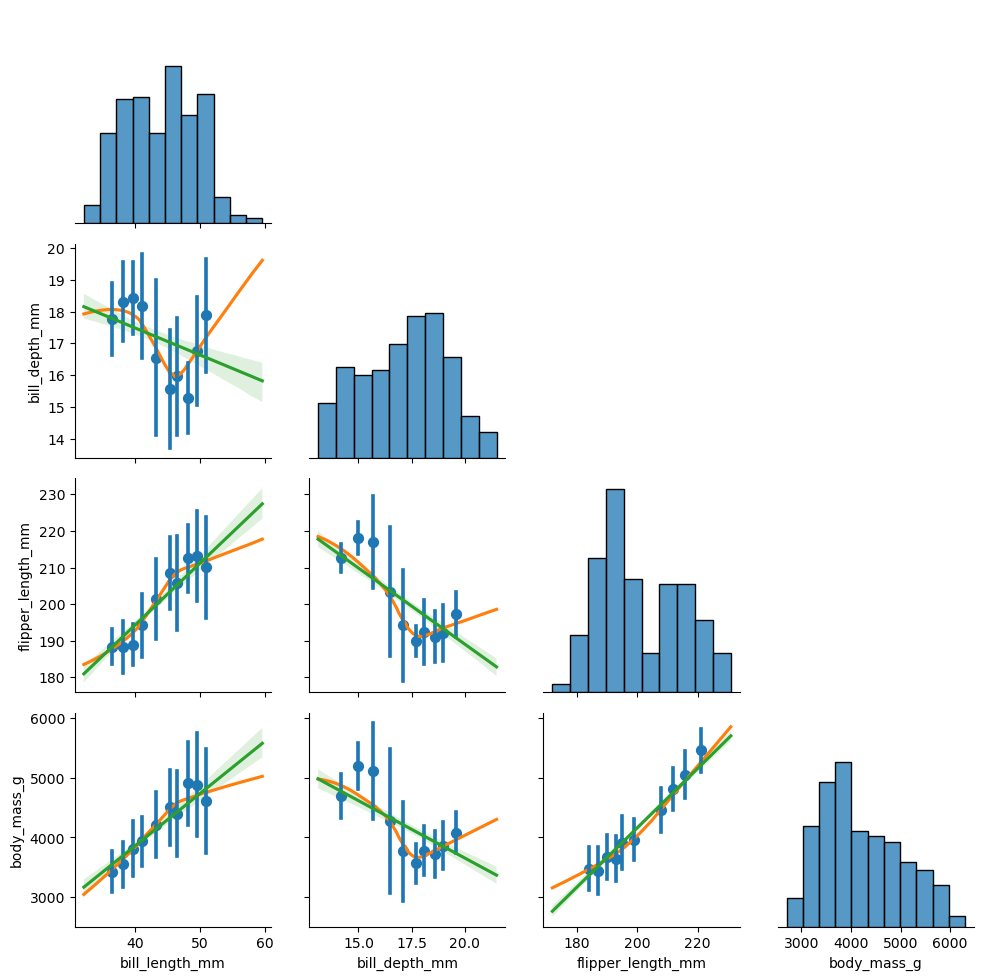
By setting hex=False, it will make a binscatter. Note that this is using seaborn’s built in regplot, which makes fewer choices than the binsreg package used on the prior website page.
pairgrid_hex_reg(penguins,hex=False,n_x_bins=10)
<seaborn.axisgrid.PairGrid at 0x17b991d9e10>